选择城市
选择城市

| 资料下载专区 | |||
| 雅思考后回忆试题 | 雅思教师预测试题 | 雅思口语题库 | 雅思写作范文集 |
导语:小烤鸭们在雅思写作过程中,是不是经常会碰到没有思路的情况?小编给大家推荐《不可错过的雅思写作范文库》,涵盖2021年每月雅思考试试题及范文,每天看一篇,相信你一定会有所进步。更多雅思复习资料请点击进入雅思听力、雅思口语、雅思阅读、雅思写作等频道,新东方雅思考试网祝你考试顺利!
饼图,1998和2008一个国家的用水量分布
The graphs show the residential water use by 5 sections in UK from 1998 to 2008.
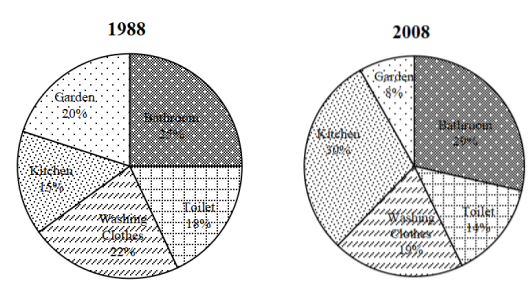
The two pie charts compare the 20-year changes in regard to water consumption among residents of UK.
Bathroom started off the highest amount in 1988, with a quarter of total water consumption, and the next two decades witnessed a 4% mount. Interestingly, this had been compensated by a 4% drop from toilet water use to 14% by 2008.
However, the researched inhabitants consumed almost a similar proportion of water in clothes washing in those years, keeping stable at roughly 20%. Additionally, the need for water used for food and kitchenware showed the most observable rise, doubling the value up to 30% until 2008.
Lastly, gardening water use had declined significantly from 20% to 8% in this period and was the lowest part of water consumer in 2008.
In conclusion, the domestic water supply in UK mainly served for hygienic purposes and the five shown purposes were comparatively stable from 1988 to 2008.