
对于流程图这种不考则以一考惊人的稀有物种,与其在进考场前默念“流程图速速退散”,不如多看多练多思考。
总结一下今年都考了哪几篇流程图,年末参加考试的同学还是多巩固一下,心里能踏实很多~
2016年5月28日 流程图-可可原豆加工

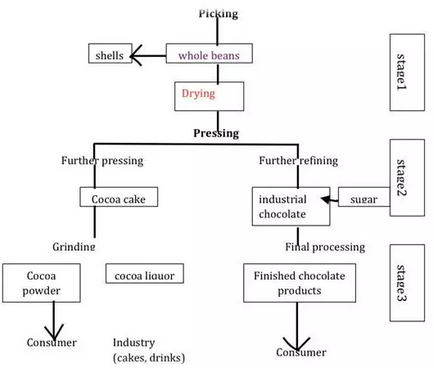
The flow-chart gives information about how the whole beans are processed into the final products for the customers. There are altogether three steps from picking beans to collecting the final products. Initially, the whole beans are picked from trees and their shells are removed, after which those beans are dried. At the next stage, we press the processed products in two ways: further pressing and further refining respectively. For the first method, after the additional pressing, cocoa cake would be ground. For the other, industrial chocolate with the combination of sugar would turn to final processing. At the last stage, after being ground, the cocoa powder would be for the consumers. The completed chocolate products, on the other hand, are for consumers as well. Besides, there is cocoa liquor for the industry of cakes and drinks. Overall, the beans are altered into the final products with the above three phases.
2016年8月4日 流程图-玻璃回收

因考生回忆有限,根据科普,我们需要掌握的词汇有:
Metal(金属)be compressed into(被压缩)chemicals(化学药剂)destaining(脱色)incinerator(焚化炉) incinerate (焚化) cooling (冷却)
放一篇以前推送过的范文作为参考:
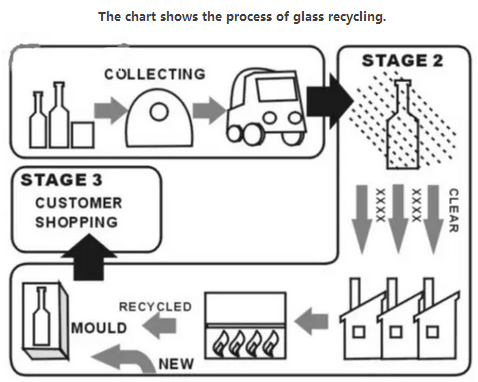
The chart shows the process of glass recycling.
The flow chart illustrates how glass is recycled. The process is divided into three stages.
At the first stage, used glasses in various forms are dumped into a recycled bin. They are collected at a collection point and then transported by a truck to a cleaning plant.
At the processing stage, there are several steps to go. Firstly, at the cleaning plant, the dirty glass products have to be washed by high pressure water. Then they are classified according to their colours, namely brown, green or clear, before they are transferred to a recycling plant where they are heated in a furnace at an extremely high temperature until they are melted. The liquid recycled glass is added with a new one and the mixture is poured into a mould to be reshaped. After the liquid gets cool, it becomes solid and is packed carefully in a box.
At the final stage, the packed glasses in different shapes are delivered to supermarkets, ready for being sold to potential customers.
2016年11月26日 流程图-能源流失情况

The diagrams below show the amount of energy lost in 100 units when it is generated from black coal and when it is generated from brown coal.
分析:好久不见的流程图终于在年末的时候重出江湖。提醒广大烤鸭们在最后的一个月要警惕流程图和地图。这种题型只要好好准备只要按部就班书写,比较简单。今天的考题中,考生们要注意按照步骤书写能源流失的情况,注意连接词的使用。然后要仔细观察不同阶段能源流失的数量,进行简单的对比。
Word count: 196
The two diagrams present the information of energy loss in every 100 units fuel energy, from black coal and brown coal respectively.
It can be seen from the first diagram that in the first stage where the brown coal is sent to the power station, there are 70 units energy wasted, accounting for a large proportion of the whole energy. In the following stage, transportation and distribution, a relative marginal amount of energy is lost (3 units), and the remainder is only 27 units when it is consumed by the consumers in the final step.
The black coal, on the other hand, shows a similar energy loss pattern compared with its brown counterpart. When it is transported, the energy loss amounts to 68 units, which means more than half of its original energy is lost. In the stage of transportation and distribution, the same quantity of energy is wasted in comparison to the brown coal. The consumers, who will finally utilize the energy, can only share a small proportion of fuel energy.
Overall, the black coal loses less energy than the brown coal and the second stage will cost most of the fuel energy.
编辑推荐:
更多内容请关注新东方网雅思频道,也可扫码关注我们的微信公共账号或加QQ群168861834。

(编辑:秦洁)
 选择城市
选择城市